Residential Data

DBT Institute of Michigan Residential Program Outcomes

General Information on Outcomes Data:​
The outcome data listed in this report includes data from all individuals who admitted to the DBT Institute of Michigan Residential DBT Program since program opening (4/1/2022 – 8/17/2025).


All clients included in these analyses had one assessment at the time of admission (completed within 4 days of admitting to the program) and at least one follow-up assessment score from a later date in treatment.


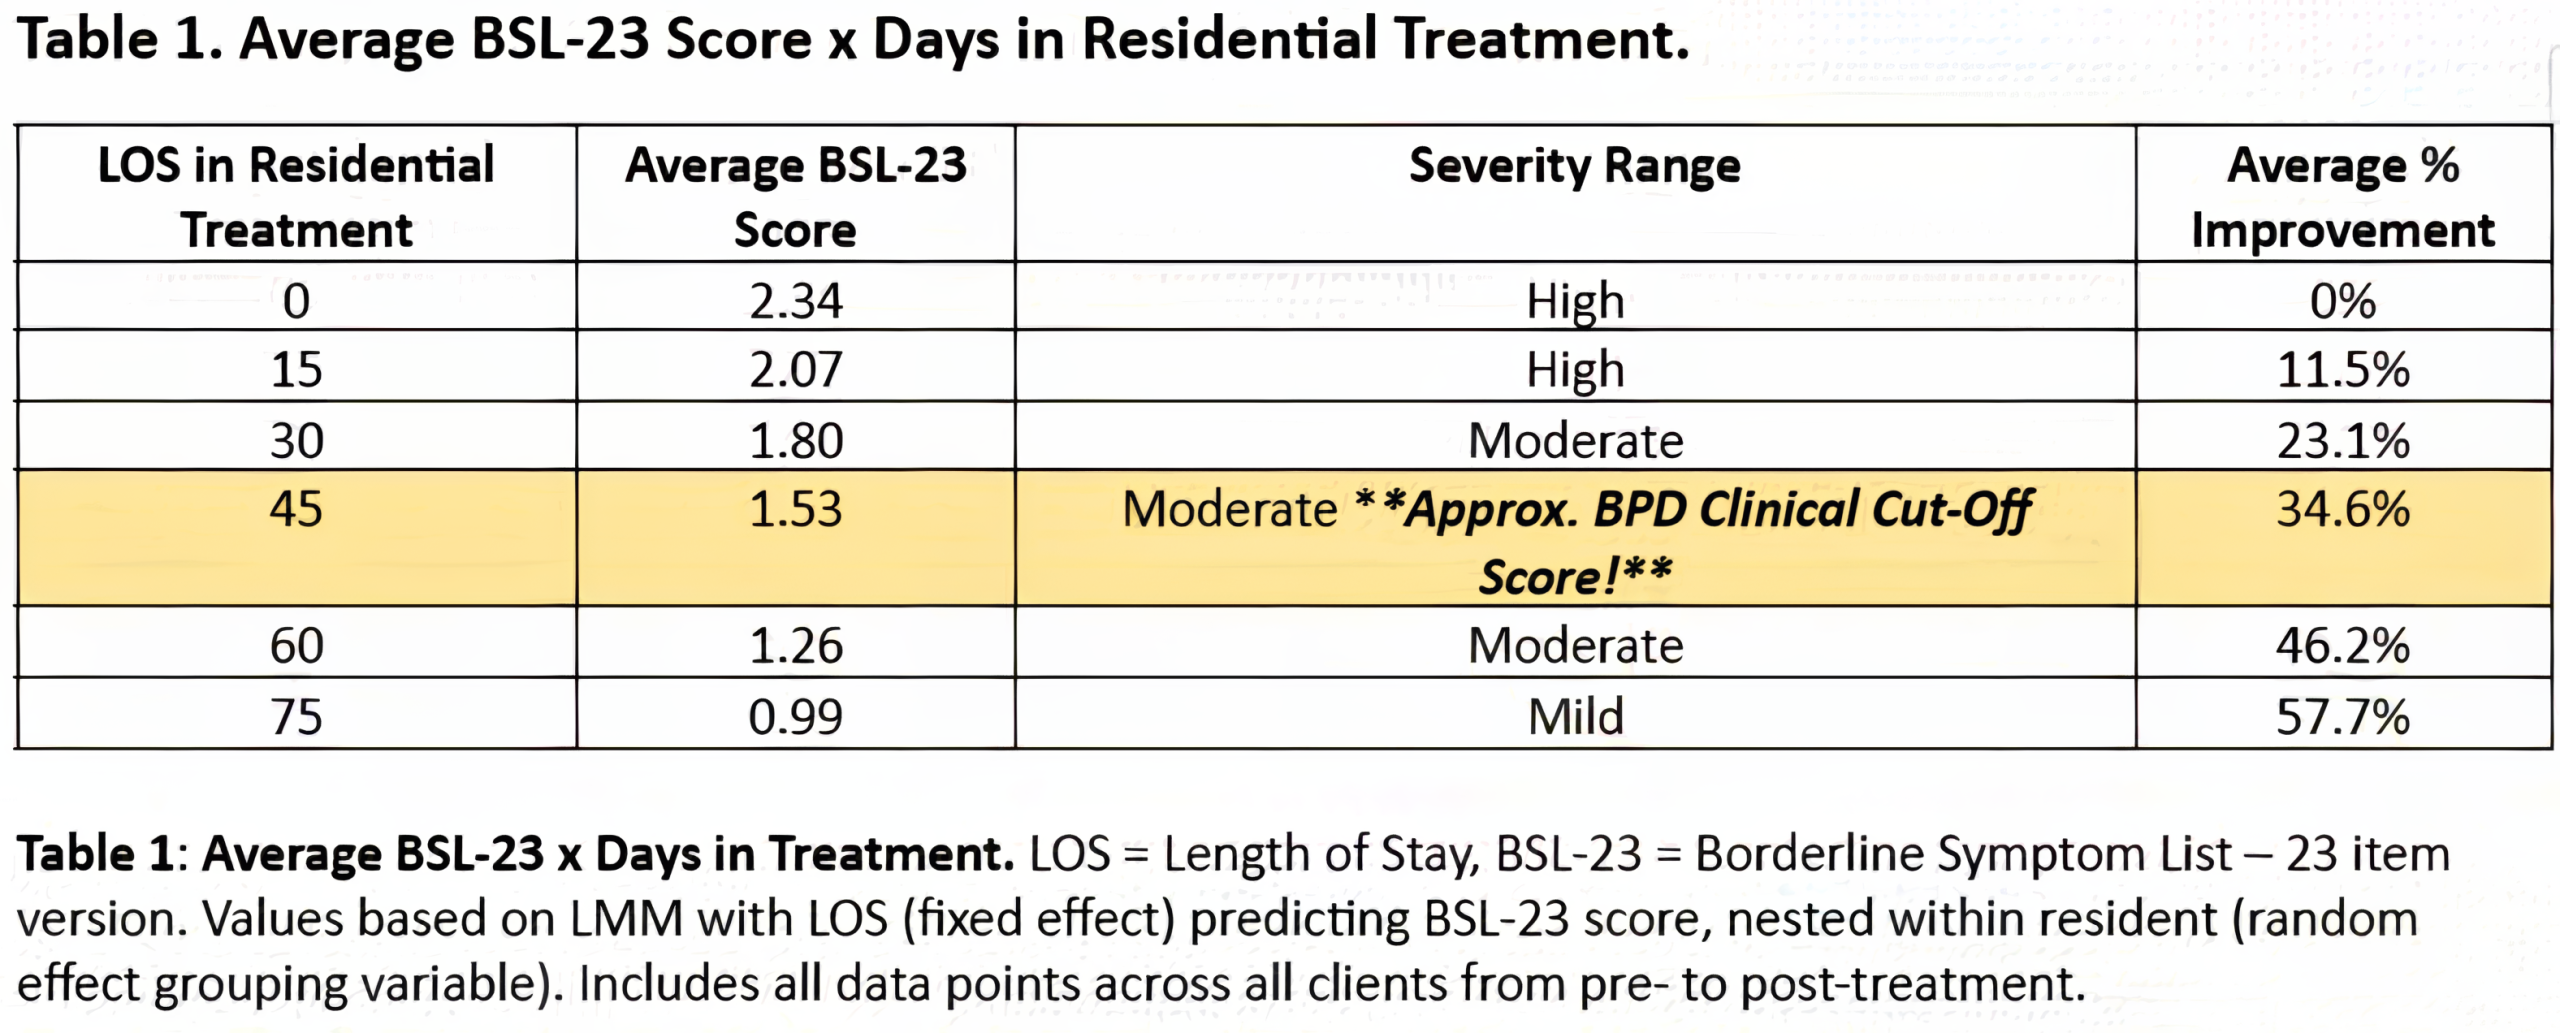
Linnear Mixed Models (LMM): Evaluates changes in self-report measures over time nested within each resident (Growth Curve Models). This maximizes statistical power as it takes all longitudinal data points into account vs. simpler pre-/post- designs and allowed us to cope with missing data points while still accounting for variability within and across residents. This approach is also more robust than pre-/post- designs against violations of statistical assumptions.
Models were fit using restricted maximum likelihood (REML) in JASP v.0.19.3.0 (JASP Team, 2024). Inferential tests for fixed effects were conducted using t-tests with Satterthwaite degrees of freedom (df). Satterthwaite df have been shown to be effective at controlling for Type I error rates when used with multilevel models (Luke, 2017).
Statistical analyses presented in the following report are results of Linear Mixed Models, which use all data points available – not specifically those identified by assessment phase (i.e., Admission, LOCF, Discharge, etc.).

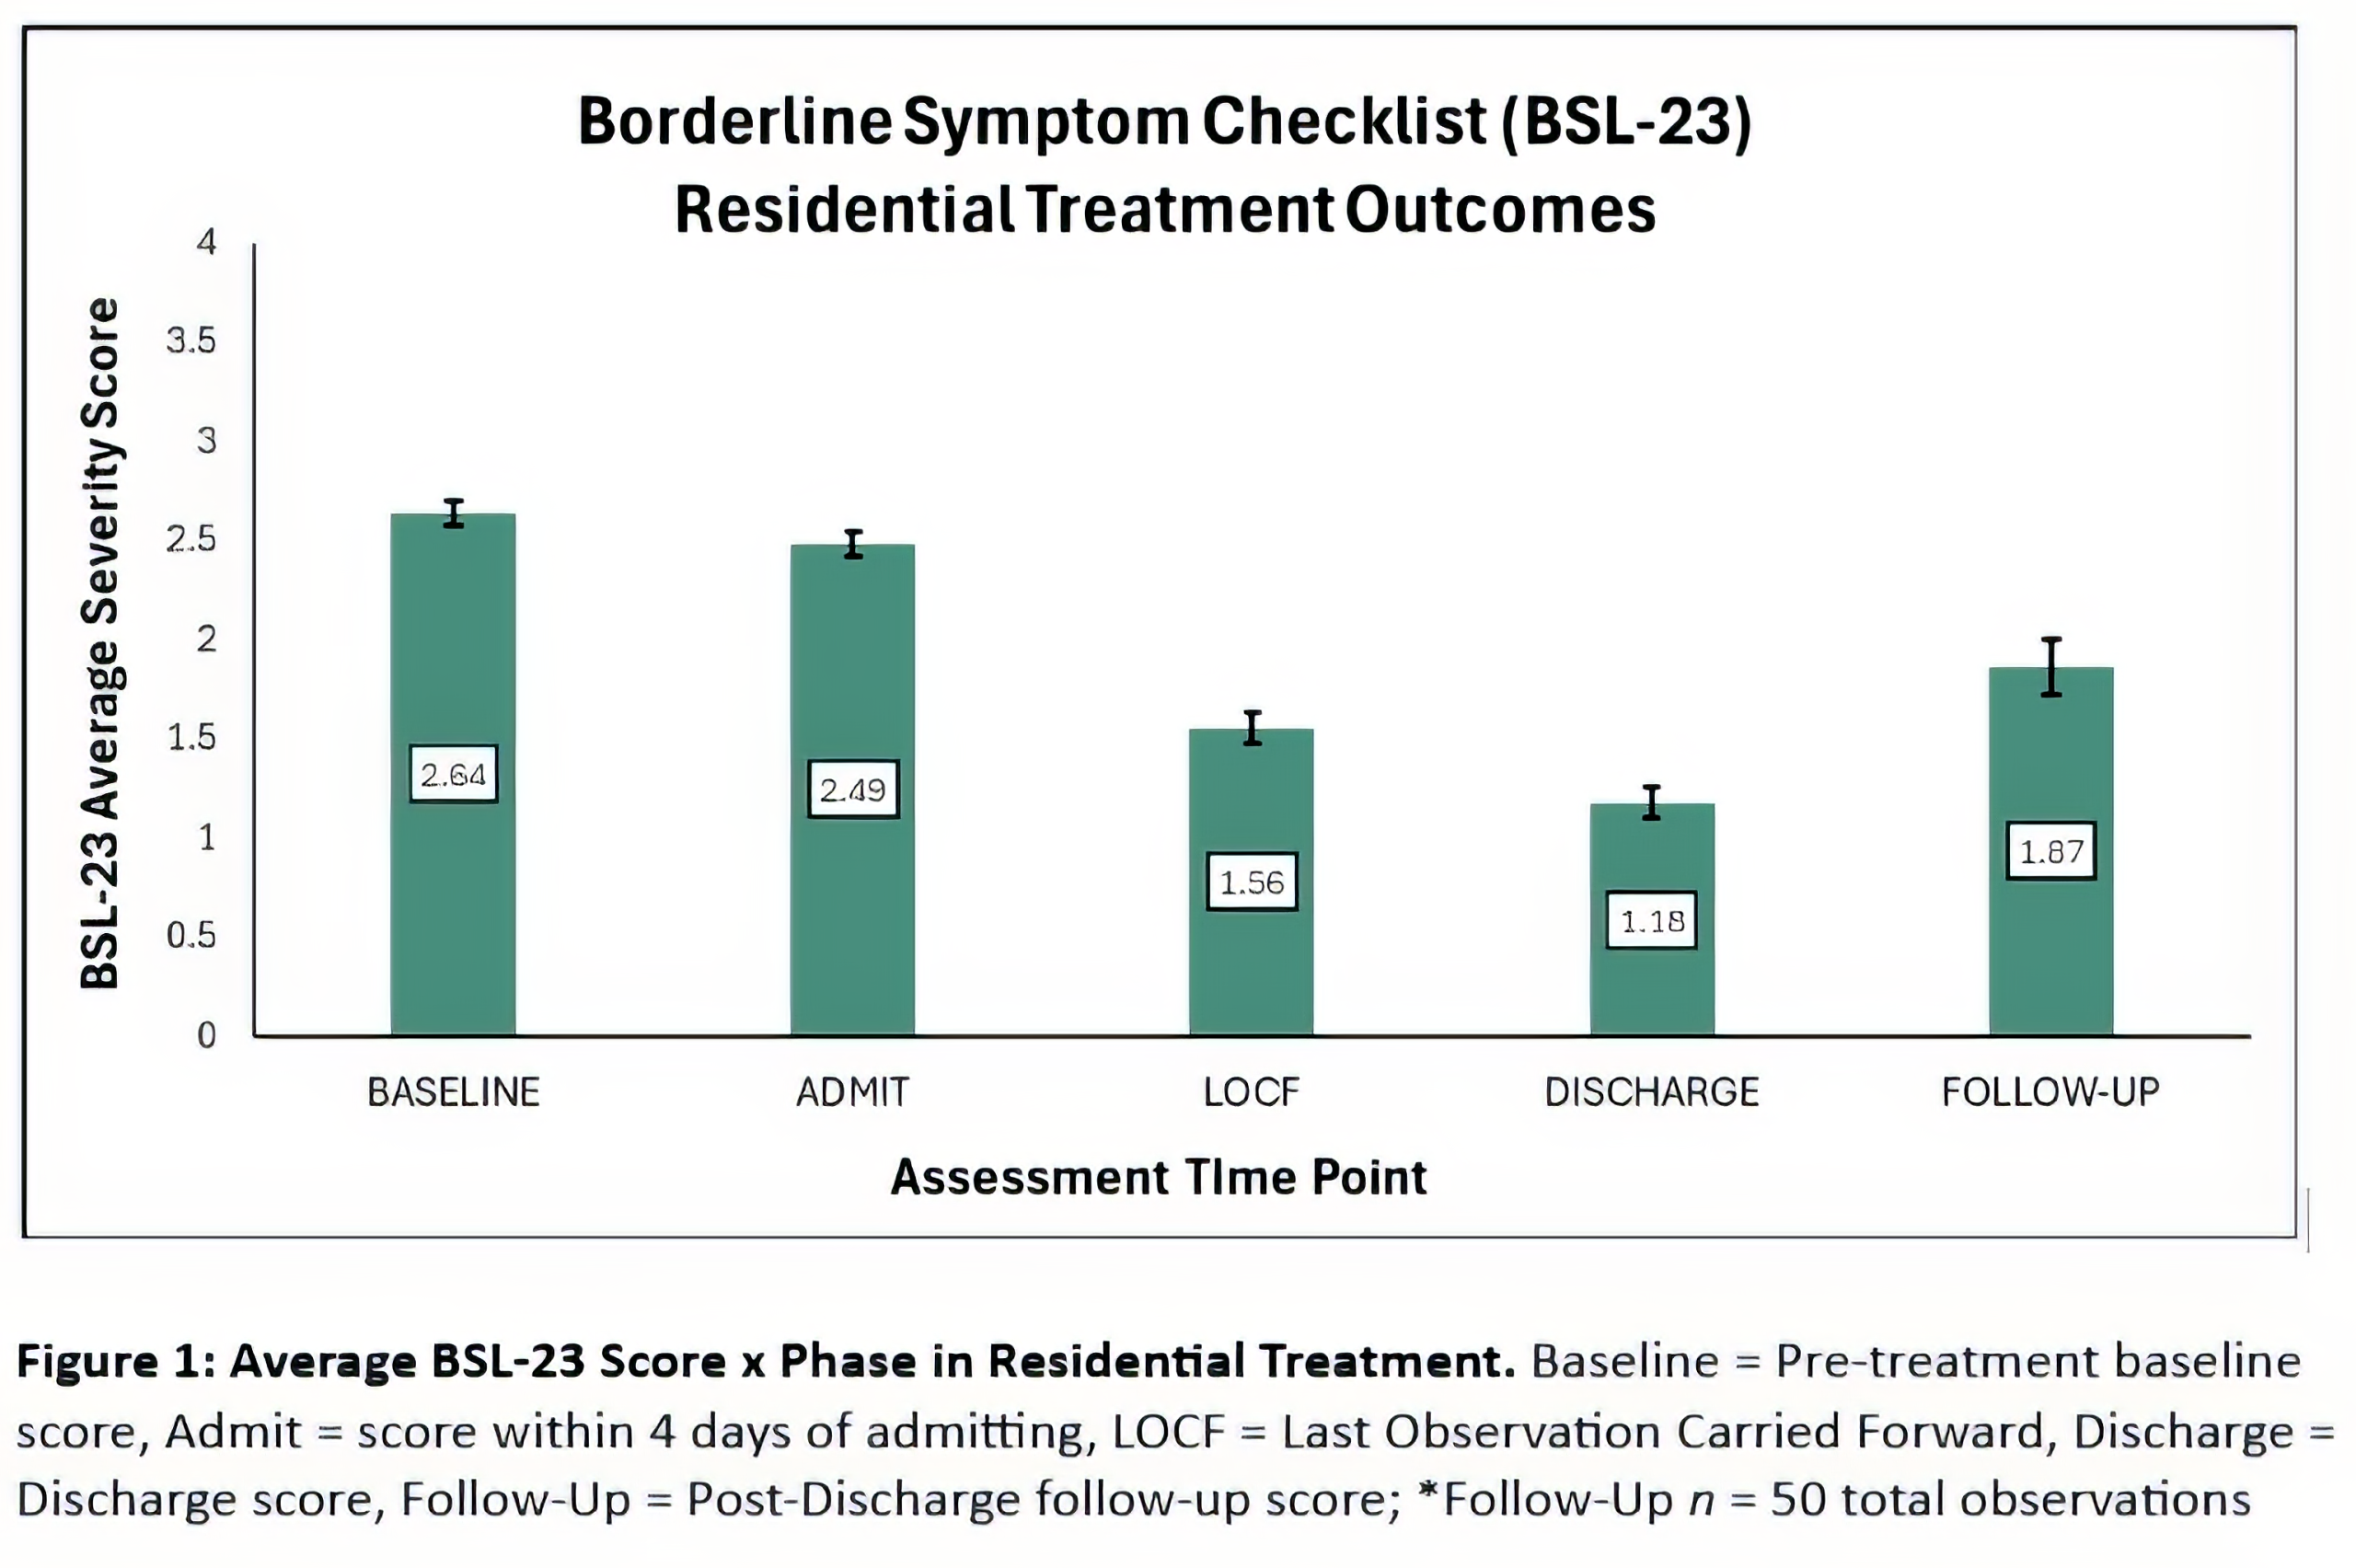
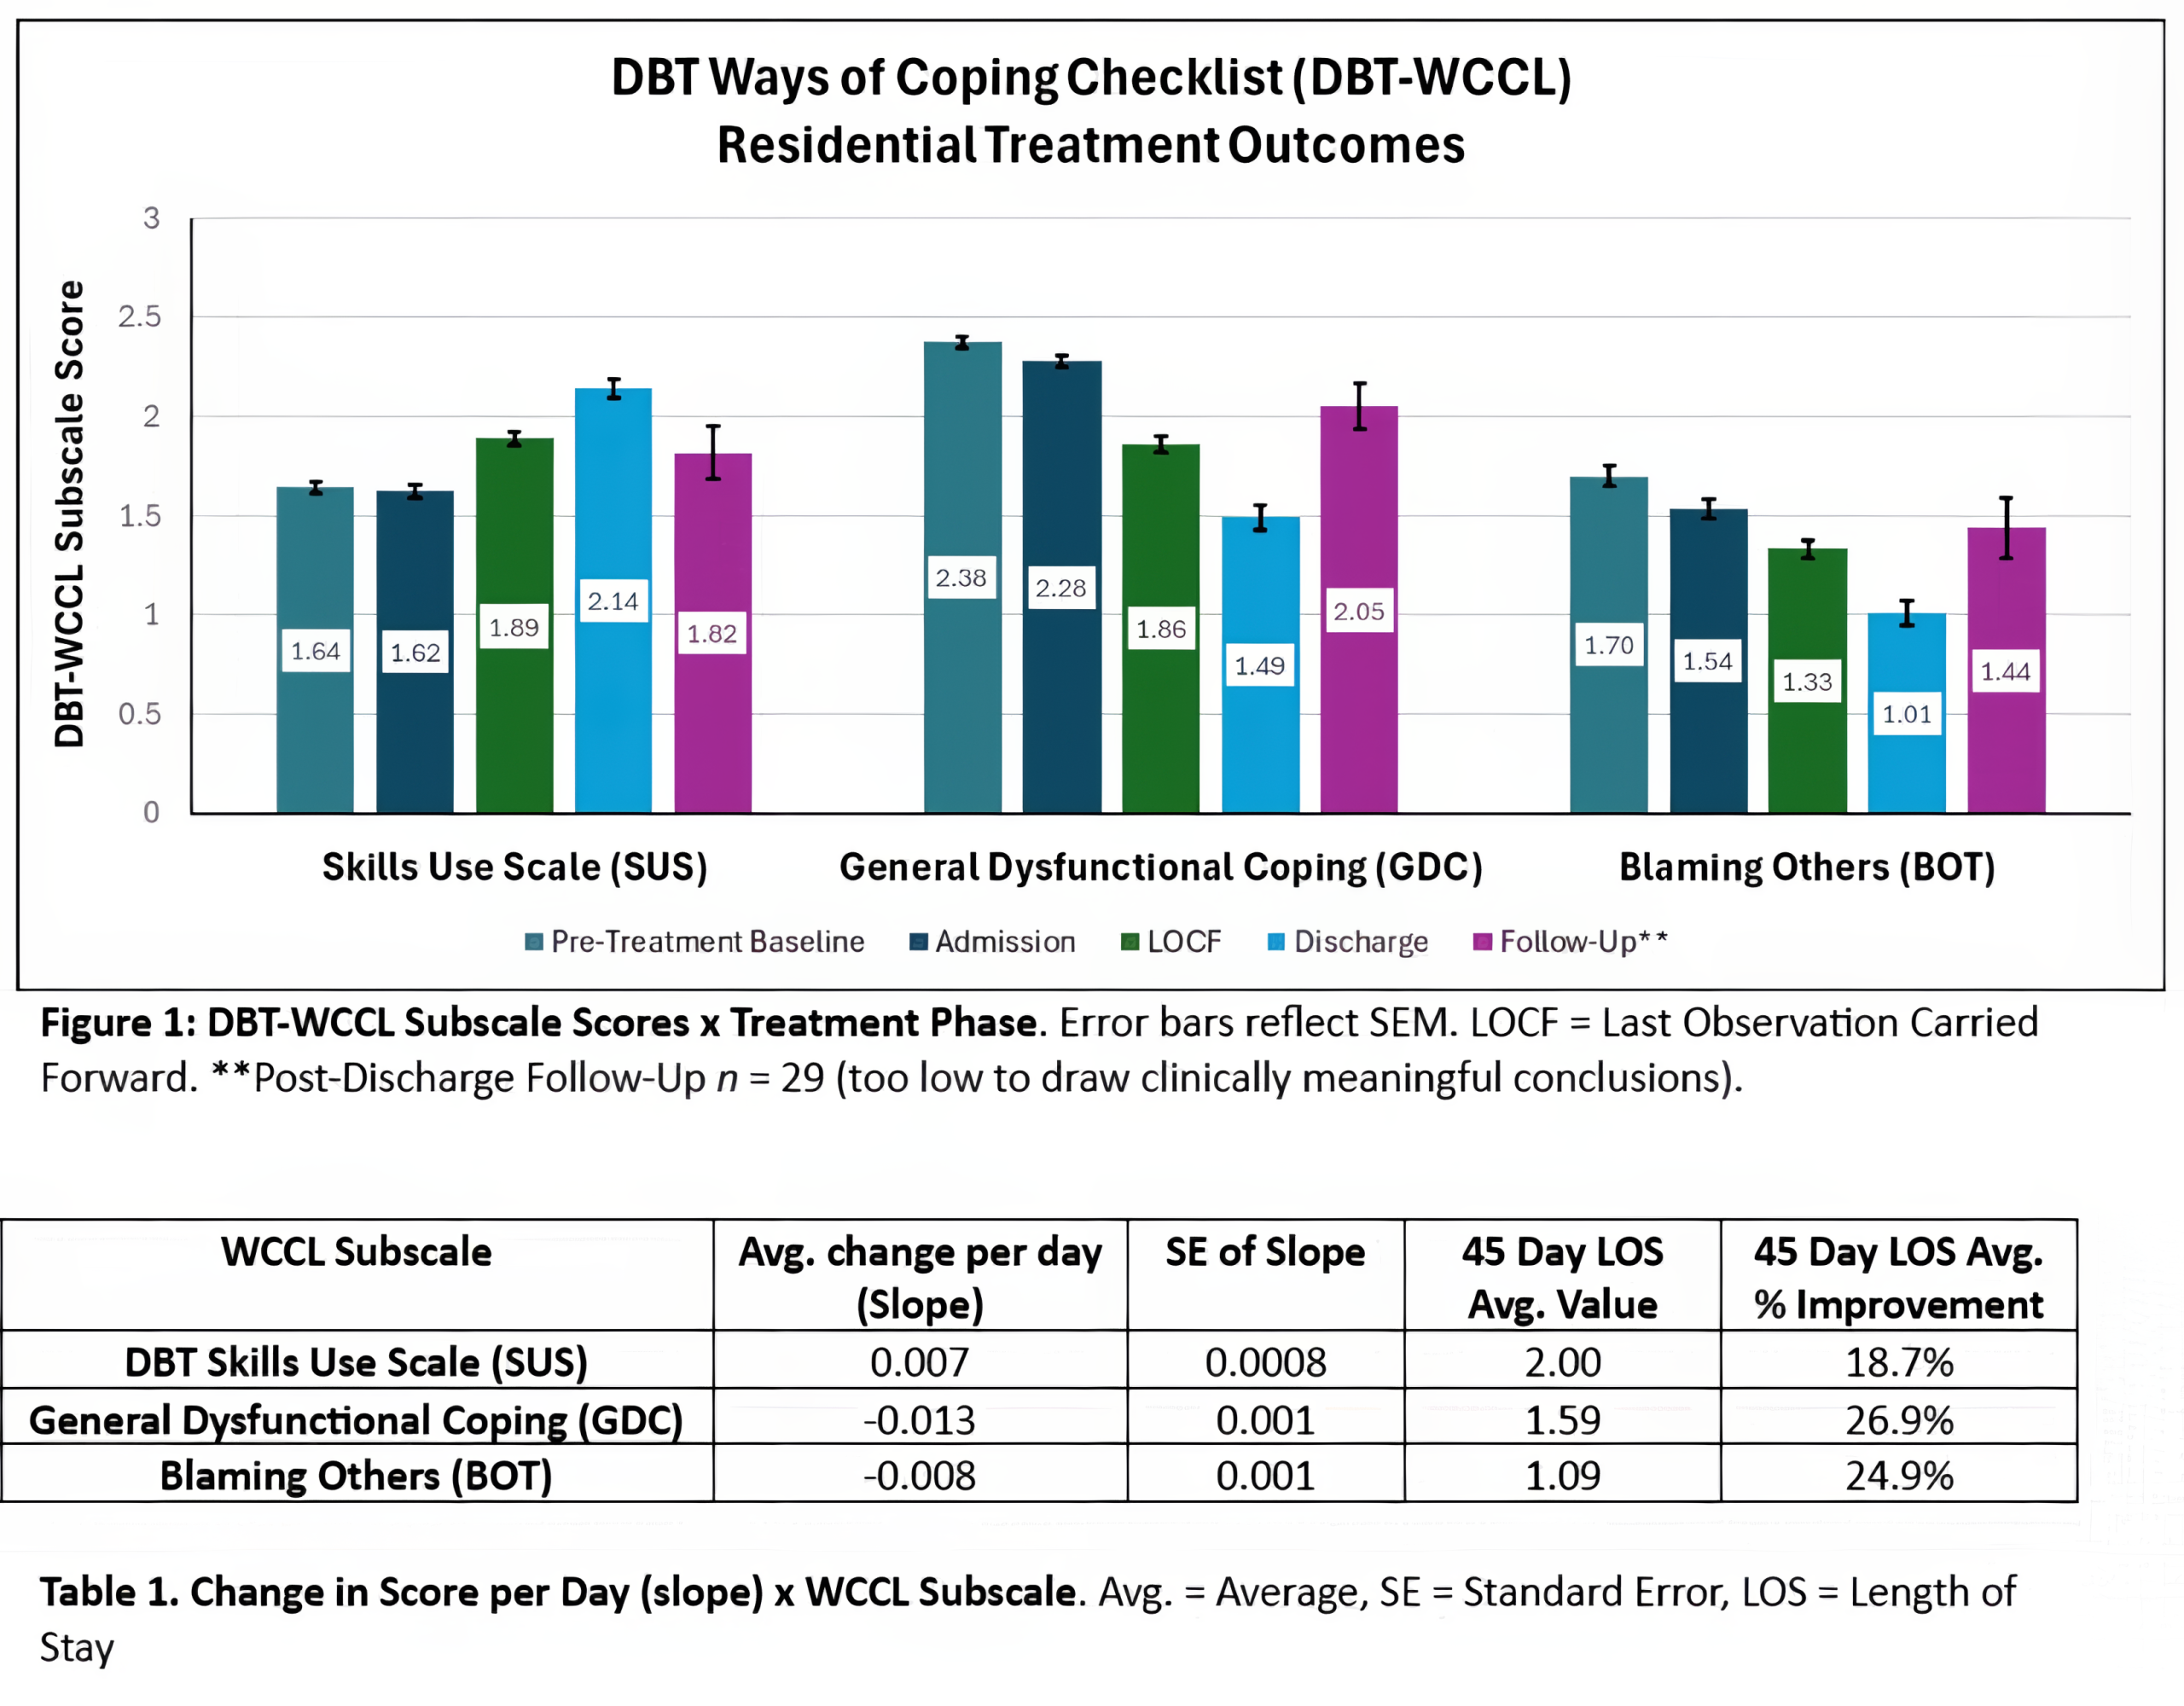
Graphs include specific assessment timepoints for data visualization purposes only. Statistical analyses were completed using all available data points.

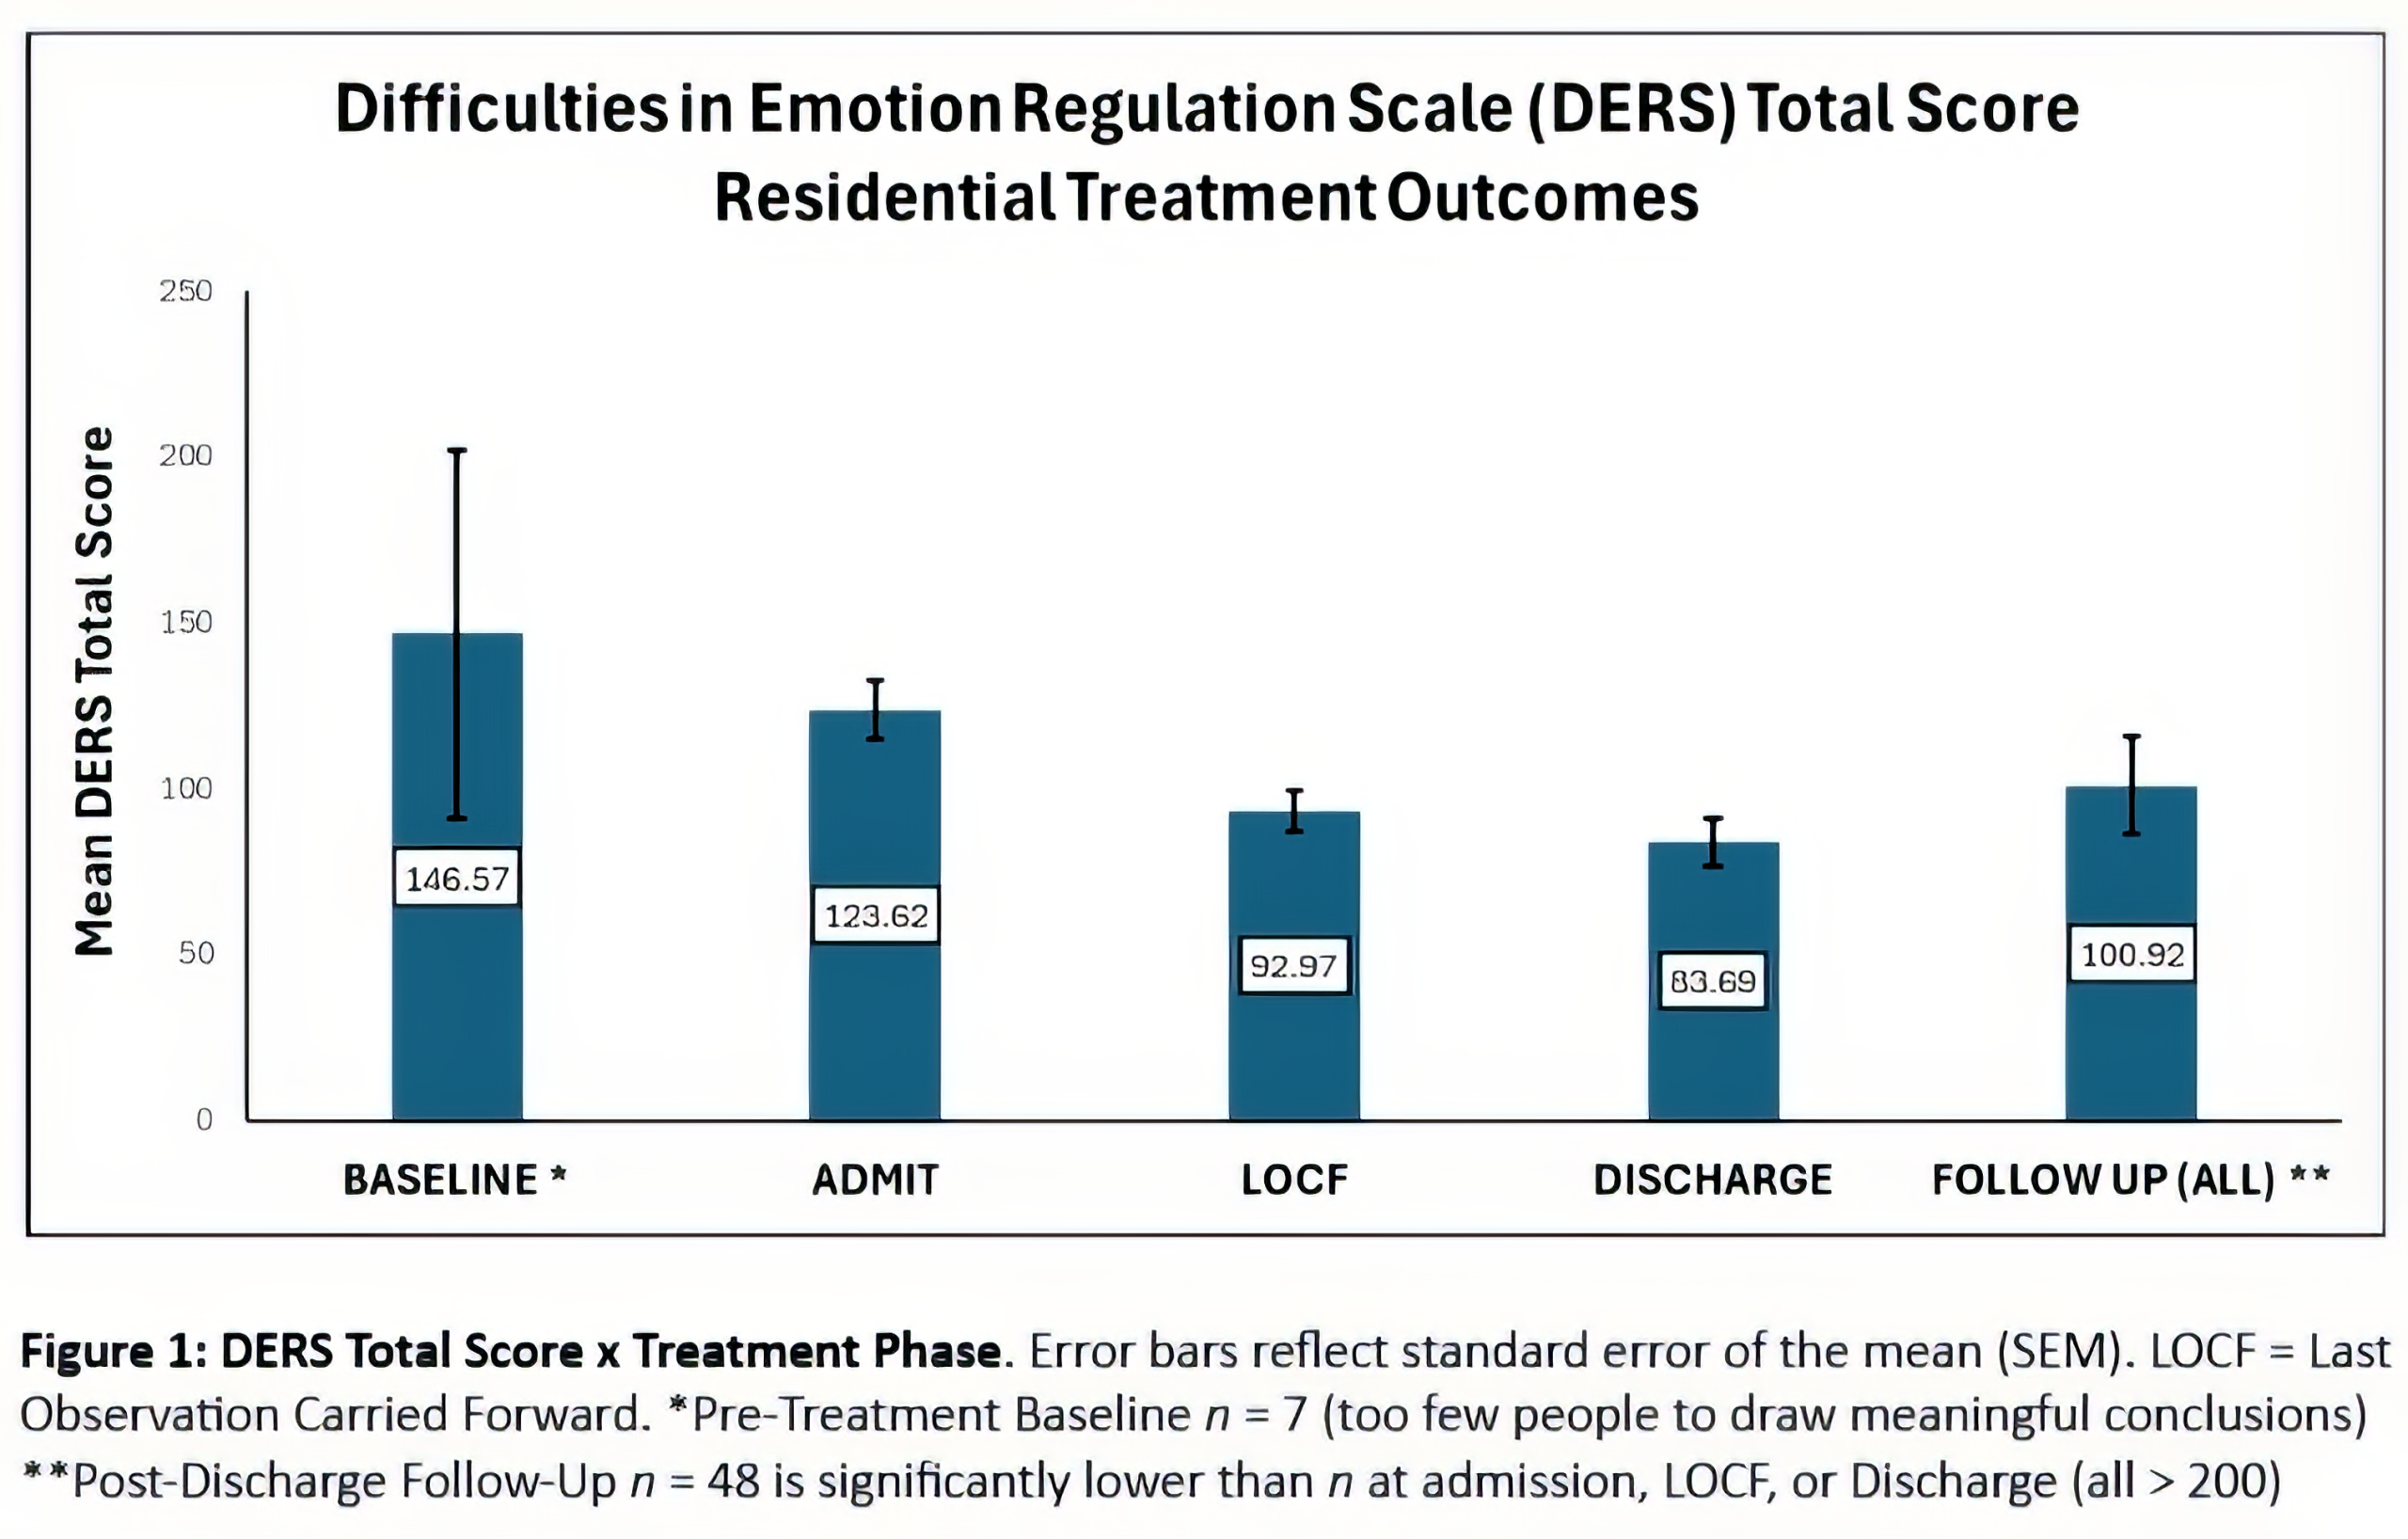
Last Observation Carried Forward (LOCF): Last observation carried forward is a common statistical approach to the analysis of longitudinal repeated measures data where some follow-up observations may be missing. In LOCF analysis, a missing follow-up visit value is replaced by that subject’s previously observed value – i.e., the last observation is carried forward.


Both LOCF and Discharge scores are included in graphs in this report as only including clients with documented discharge assessments would exclude a high percentage of all residents’ data. Moreover, it is unknown if the residents who completed discharge assessments are reflective of all clients’ end-of-treatment assessment scores on average vs. if there are confounding factors that make these groups different – i.e., clinical characteristics that contributing to abrupt or premature discharge causing missing discharge data.


Borderline Symptom List – 23 Item Version (BSL-23):


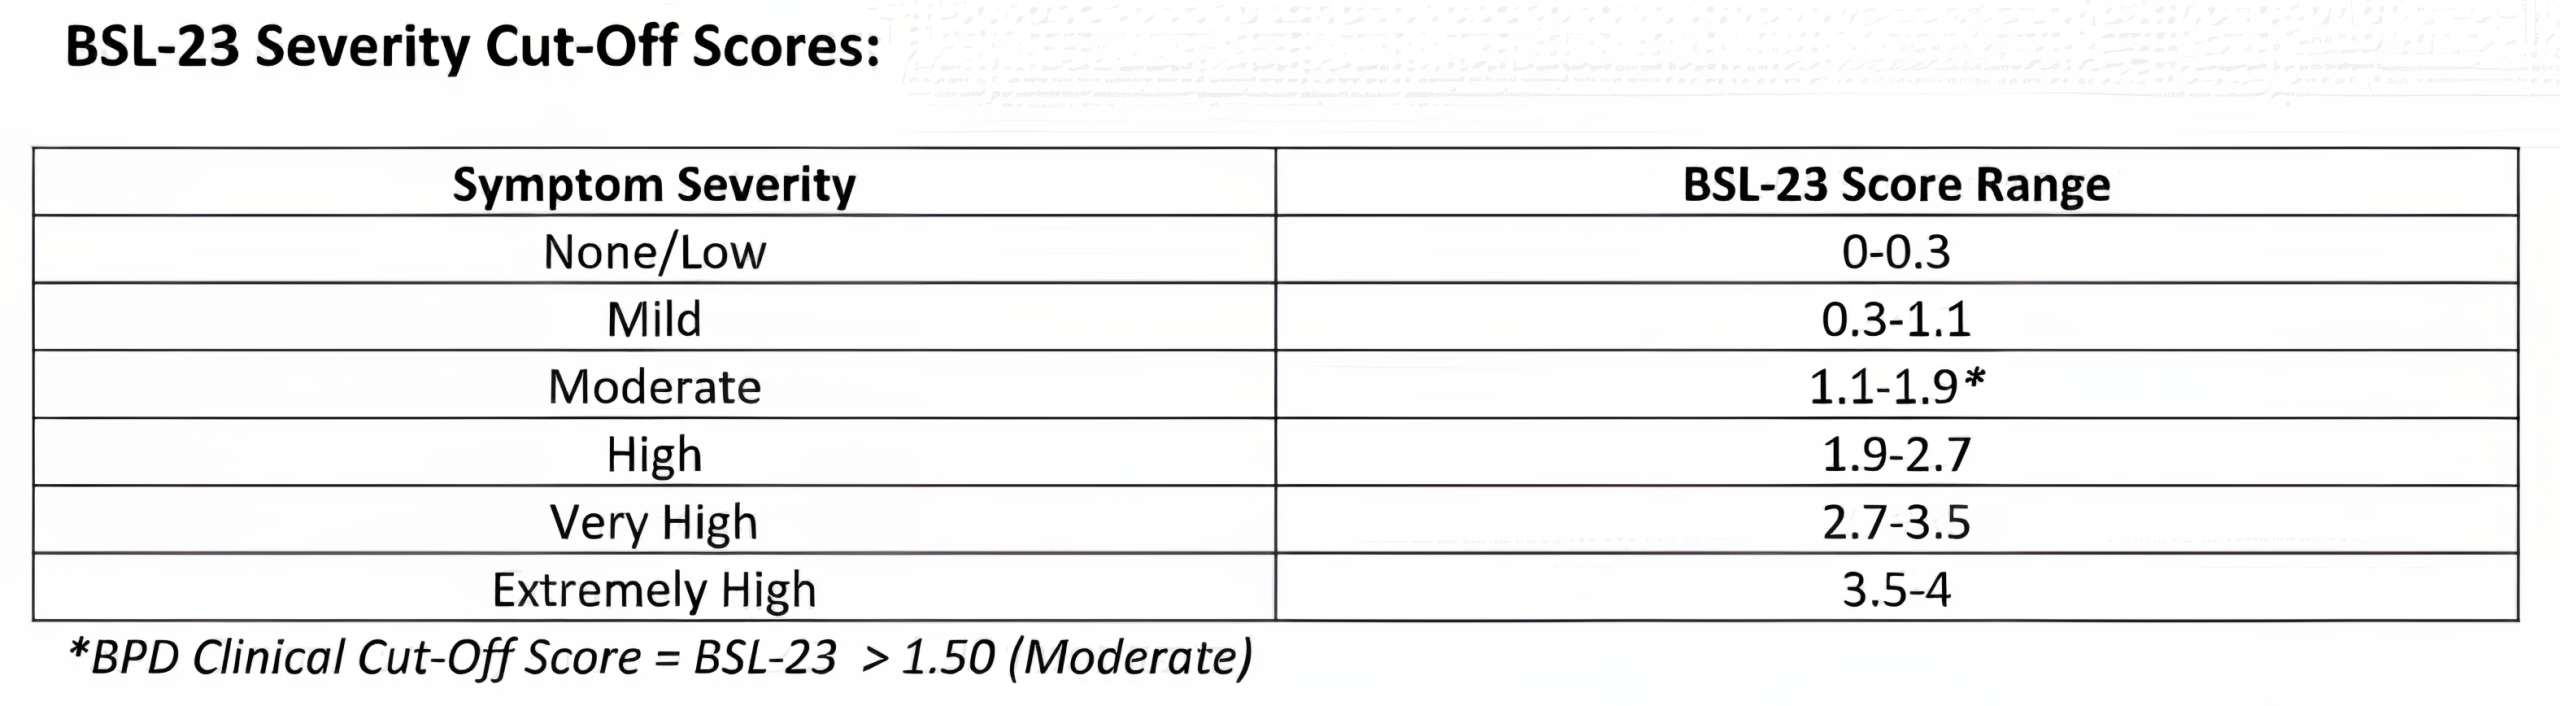
Description: The Borderline Symptom List-23 (BSL-23) is a 23-item self-report measure that is a reliable and valid self-report instrument for assessing symptoms of Borderline Personality Disorder (BPD).  Items are rated from 0 (None at all) to 4 (Very strong).


Interpretation: Higher scores indicate greater BPD symptom severity. Clinical Cut-Off Score = 1.50+. This clinical cutoff score of 1.50 discriminates between clients likely to meet criteria for BPD vs. other psychopathology (Kleindienst et al., 2020).


​​

Summary of Residential Outcomes: 
Statistically significant improvement (decrease) in BPD symptoms over time during residential treatment (t (129.98) = -9.90, p < 0.0001). The linear growth model indicated that BPD symptoms (BSL-23 Average Severity Score) significantly improved (decreased) as time in treatment (Length of Stay (LOS)) increased while controlling for individual client-level variability in symptom change over time.

For every 1 additional day in residential treatment, BSL-23 Average Severity Score decreases by 0.02 points on average (estimated slope = -0.018, SE = 0.002) across residential program clients.

DBT Ways of Coping Checklist (DBT-WCCL):


Description: The DBT Ways of Coping Checklist (DBT-WCCL) (Neacsiu et al., 2010) is a reliable and valid 59-item self-report inventory designed to assess clients’ use of adaptive DBT skills vs. dysfunctional coping behaviors in their daily lives. Items are rated using a 4-point scale from Never Used to Regularly Used, with “regularly used” indicating use of that thought or behavior at least 4-5 times per week.


Interpretation: The DBT-WCCL yields three subscale scores: DBT Skills Use Subscale (SUS), General Dysfunctional Coping Subscale (GDC), and Blaming Others (BOT). Subscale scores range 0-4 with higher scores indicating greater use of coping strategies (functional or dysfunctional) assessed.
Summary of Residential Outcomes: 

Linear growth models indicate a statistically significant increase in DBT Skills Use (Skills Use Subscale (SUS); t (118.3) = 9.24, p < 0.0001); statistically significant decrease in overall use of General Dysfunctional (ineffective) Coping mechanisms (General Dysfunctional Coping (GDC); t (155.7) = -10.80, p < 0.0001), and statistically significant decrease in Blaming Others (t (107.2) = -7.06, p < 0.0001).

Difficulties in Emotion Regulation Scale (DERS):
Description:
The Difficulties in Emotional Regulation Scale (DERS) is a 36-item self-report measure designed to assess multiple aspects of emotion dysregulation. It has been found to be a reliable and valid measure of emotional dysregulation difficulties in both adults and adolescents. The DERS yields a total score as well as scores on six subscales.


Interpretation:
Total Scores range from 36-180.  Higher scores indicate greater emotional dysregulation.


Summary of Residential Outcomes: 
Statistically significant improvement (decrease) in total emotion dysregulation difficulties over time in residential treatment. The linear growth model indicated that emotional dysregulation (DERS Total Score) significantly improves (decreases) as time in treatment (Length of Stay (LOS)) increases while controlling for client-level variability (t (127.5) = -11.26, p < 0.0001). 
For every 1 additional day in residential treatment, DERS Total Score decreases by 0.75 points on average (estimated slope = -0.68, SE = 0.06). For a 45 day length of stay, this equates to an estimated DERS Total Score = 90.38 (25.3% improvement from average DERS Total Score upon admission).

GET IN TOUCH

We Would Love To Hear From You